
Special Education Services
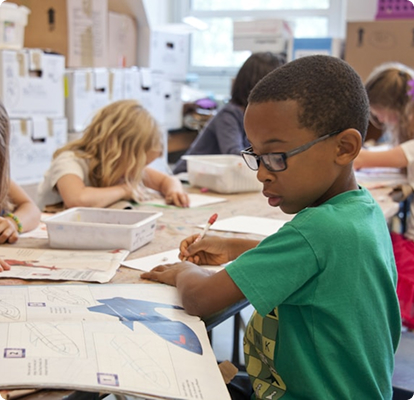
7.5 million students received special education services under IDEA during the2022–2023 school year — 15% of all public school students.
Prevalence

1 in 6 children in the U.S. (ages 3–17) has a developmental disability.
Types of Disabilities Most Commonly Reported

In 2022–23, the number of students ages 3–21 who received special education and/or related services under the Individuals with Disabilities Education Act (IDEA) was 7.5 million, or the equivalent of 15 percent of all public school students. Among students receiving special education and/or related services, the most common category of disability was specific learning disabilities […]
Types of Disabilities Most Commonly Reported
In 2022–23, the number of students ages 3–21 who received special education and/or related services under the Individuals with Disabilities Education Act (IDEA) was 7.5 million, or the equivalent of 15 percent of all public school students. Among students receiving special education and/or related services, the most common category of disability was specific learning disabilities […]
Special Education Services
7.5 million students received special education services under IDEA during the2022–2023 school year — 15% of all public school students.
Prevalence
1 in 6 children in the U.S. (ages 3–17) has a developmental disability.